
 Submit a Paper
 Propose a Special lssue
 Open Access
ARTICLE

Thermal Behavior of a LFP Battery for Residential Applications: Development of a Multi-Physical Numerical Model
1 Consiglio Nazionale delle Ricerche-Istituto di Scienze e Tecnologie per l’Energia e la Mobilità Sostenibili (CNR-STEMS), via G. Marconi, 4, Naples, 80125, Italy
2 Department of Industrial Engineering, University of Naples “Federico II”, P.le Tecchio 80, Naples, 80125, Italy
3 FIB S.p.A. (FAAM brand)—Gruppo SERI, Strada Statale via Appia 7bis km 15400, Carinaro, 81030, Italy
* Corresponding Author: Michela Costa. Email:
(This article belongs to the Special Issue: Selected Papers from the SDEWES 2024 Conference on Sustainable Development of Energy, Water and Environment Systems)
Energy Engineering 2025, 122(5), 1629-1643. https://doi.org/10.32604/ee.2025.062613
Received 23 December 2024; Accepted 01 April 2025; Issue published 25 April 2025
 View Full Text
 Download PDF
Abstract
Effective thermal management is paramount for successfully deploying lithium-ion batteries in residential settings as storage systems for the exploitation of renewable sources. Uncontrolled temperature increases within battery packs can lead to critical issues such as cell overheating, potentially culminating in thermal runaway events and, in extreme cases, leading to fire or explosions. This work presents a comprehensive numerical thermal model of a battery pack made of prototype pouch cells based on lithium ferrophosphate (LFP) chemistry. The multi-physical model is specifically developed to investigate real-world operating scenarios and to assess safety considerations. The considered energy storage system is a battery designed for residential applications, in its integration with a photovoltaic (PV) installation. The actual electrochemical behavior of the prototype cell during the charging and discharging processes is modeled and validated on the ground of experimental data. The essential steps leading to the numerical schematization of the battery pack are then presented to apply the model to two different use scenarios, differing for the user loads. The first scenario corresponds to a typical residential load, with standby lights being active during the night, solar generation with its peak at noon, and appliance use shifting in the afternoon and the evening. In the second scenario, a double demand for energy is present that makes the battery never reach 100% of the State of Charge (SoC) and discharge more rapidly with respect to what occurs under the first scenario. Comparing the simulated temperature with the assumed C-rate, namely the charge or discharge current divided by the battery nominal capacity, it is found that peaks coincide with the charging phase; subsequently, the current tends to a zero value, and consequently, the temperature suddenly reaches the value of the environment. Finally, the model is also utilized to simulate a condition of thermal runaway by introducing critical conditions within a specific pouch cell. In this simulation, the thermal exchange between the cell in thermal runaway and the rest of the system remains within acceptable limits. This occurs due to the short duration of the process and to the module casing coated with an insulating material. The work provides an essential foundation for conducting numerical simulations of battery packs operating also at higher power levels.Keywords
The transition to renewable energy sources, like solar and wind power, presents a crucial challenge in reliable energy storage. Electrochemical technologies, particularly lithium-ion batteries, offer great potential to properly exploit renewables according to actual loads, due to their high energy density and versatility. Nevertheless, their long-term viability hinges on achieving even higher energy density, potentially through next-generation electrochemistry options, and especially on solving safety issues that remain of utmost importance for all battery technologies and their applications.
The present paper is the first step made by authors in exploring, through a dynamic numerical simulation model, the potential thermal hazards associated with a prototype lithium-ion battery conceived for residential applications [1].
For many years, Lithium-ion technologies have dominated the power market for portable electronics such as smartphones, electronic cigarettes, laptops, and digital cameras, and more recently are being increasingly used to store energy on electric vehicles (EVs) as well as in steady applications.
Generally speaking, two are the main topics of concern for correct battery operation, namely controlling the charge/discharge cycle of a battery pack and managing the heat that arises from the operation itself by the Joule effect [2]. The latter is encapsulated in the former, as temperature has a massive impact on the lifetime performance of all lithium-ion-based battery technologies. A temperature rise accelerates the ongoing electrochemical reactions within the cell, further generating heat. In ideal conditions, the heat should be dissipated from the cell. However, circumstances occur where heat is generated at a rate several times higher than that at which it is dissipated, and the so-called thermal runaway process may occur. A general definition establishes that a cell reaches thermal runaway when its temperature rises uncontrollably, at a rate greater than 20°C per minute with maximum temperatures reaching values greater than 300°C, accompanied by gas and/or electrolyte venting, smoke or fire or a combination of them.
The scientific literature on the matter, indeed, includes many works. A Scopus search that, in particular, was made in December 2024 on the keywords battery, thermal, lithium, and ion, led to a total number of 3145 documents published only in the last year, hence in 2024, and including the preprint of 2025. An analysis of the occurrence of keywords in these documents is reported in Fig. 1, as derived from the use of the VosViewer package, described in ref. [3]. One may note that 4 clusters are evident, one of which is related to the management of batteries, and another one relevant to safety issues.
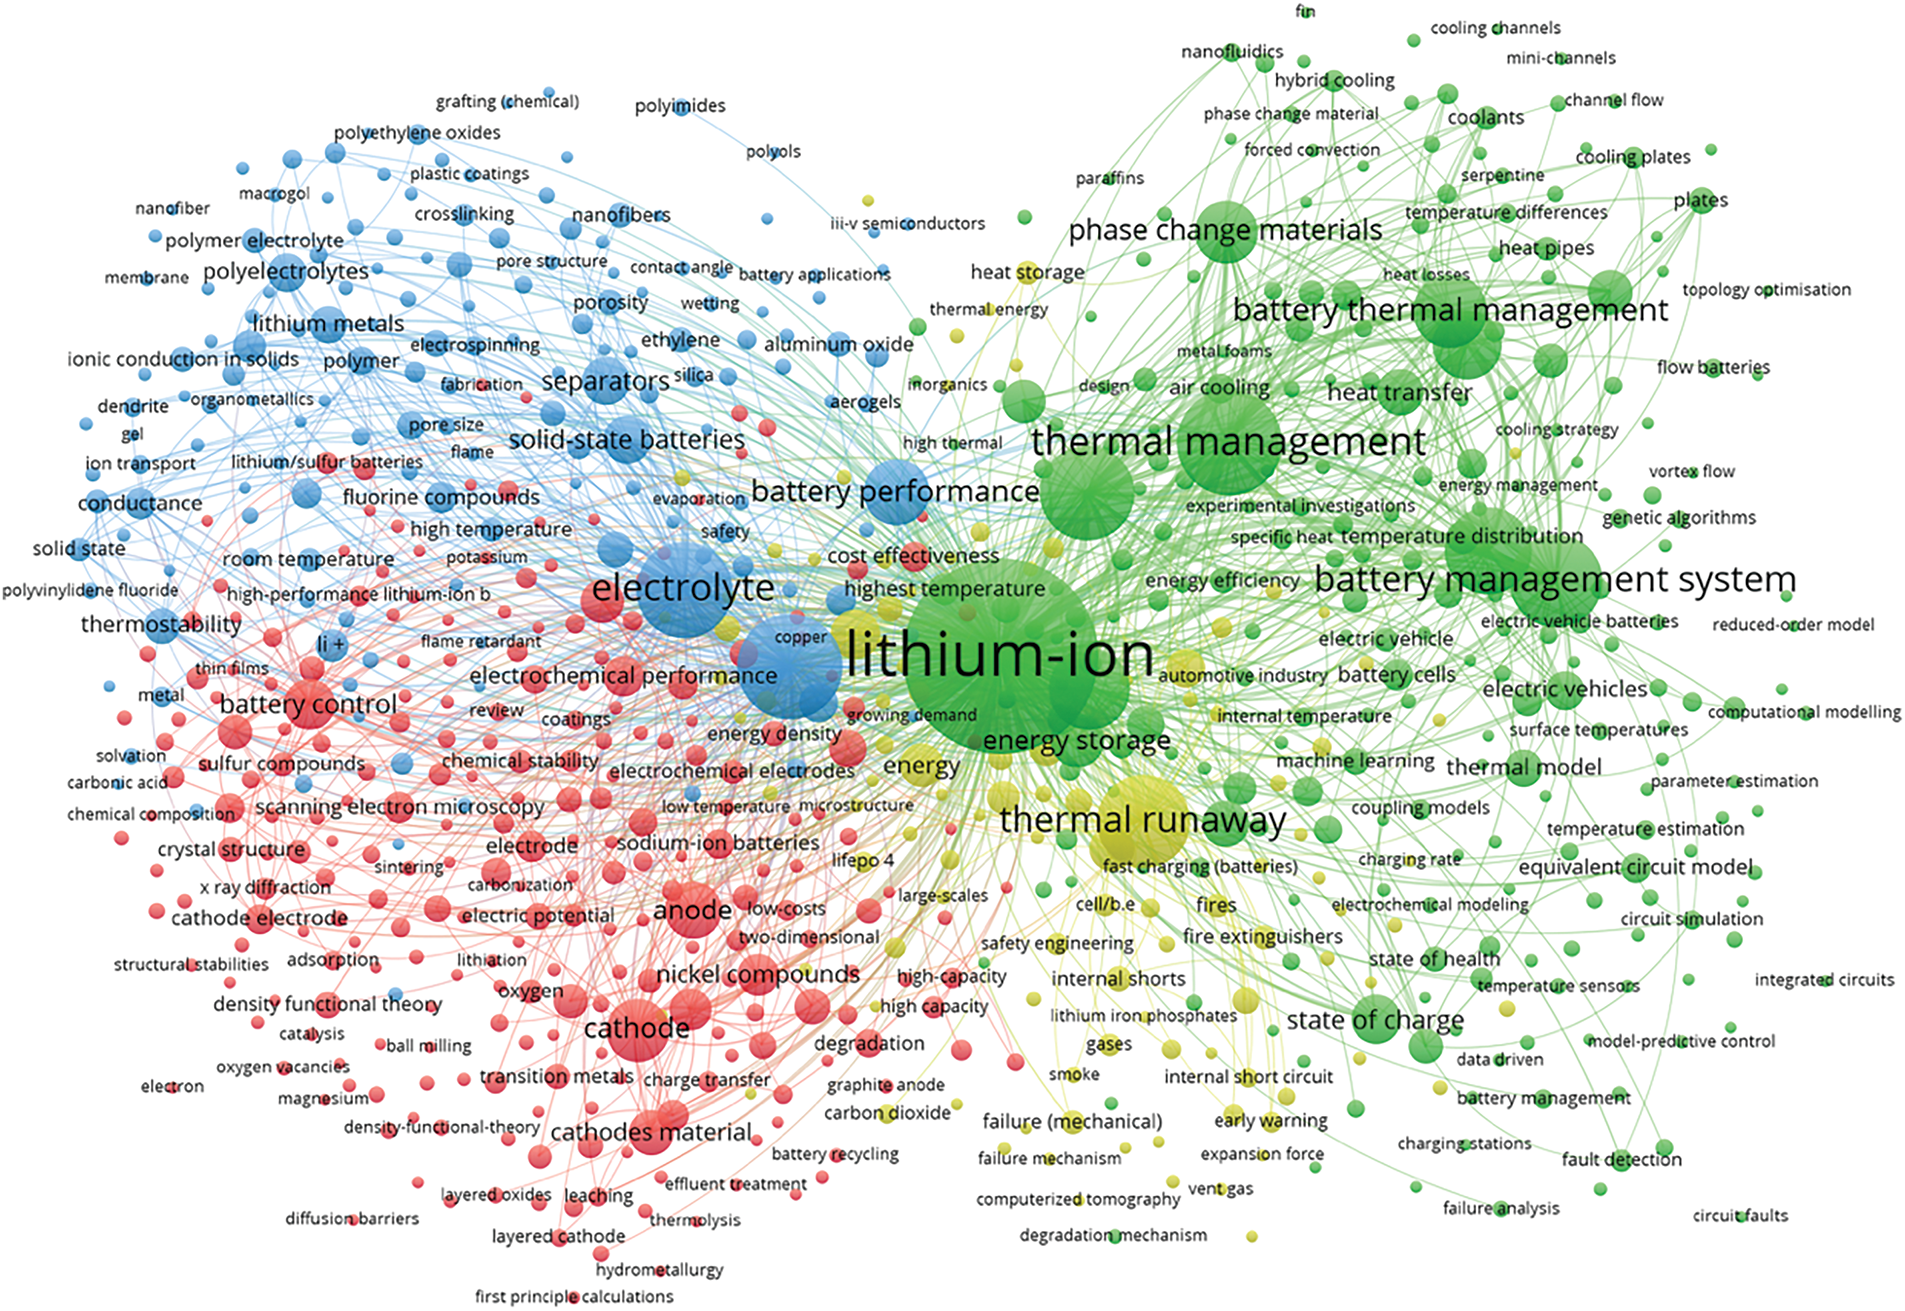
Figure 1: Bibliometric analysis of articles on thermal issues related to lithium-ion batteries published from 2024 according to Scopus
Indeed, Li-ion batteries have often been prone to catch fire and explode, since their introduction [4]. Just to give some examples, the U.S. Postal Service even stopped the international shipment of Li-ion batteries in 2012 because of overheating and explosion issues [5]. The latest fire safety issues relevant to EV applications were reviewed in ref. [6]. Extensive research has indeed established a clear correlation between temperature and battery health. Xu et al. [4] warned of accelerated electrode degradation and reduced electrolyte stability at elevated temperatures. This concern was echoed in time, say by refs. [7,8] in their comprehensive review, which highlighted thermal runaway as a dangerous chain of reactions leading to fire and explosion, hence as a significant safety risk in improperly managed batteries. Conversely, researchers such as Wang et al. [9] demonstrated that cold temperatures can be equally detrimental, hindering battery performance by limiting ion mobility and reducing power output.
The confluence of progress in lithium-ion battery technology, battery management systems (BMSs), and battery thermal management (BTM) solutions is currently indicative of a transformative change within various applications, in particular in the realm of sustainable transportation. Indeed, for the most popular lithium-ion batteries used in most EVs (i.e., Panasonic 18,650 cell), performance degrades as their operating temperature increases beyond the optimum operation range, thus affecting the autonomy, reliability, and user experience of electric propulsion. Battery performance at a temperature higher than 40°C or below −10°C suffers critical battery capacity loss and hence performance degradation.
The field of BTM is therefore not only of paramount importance, but it is also constantly evolving, with researchers exploring various strategies to achieve optimal temperature control [10,11]. Current state-of-the-art approaches mainly include air cooling, a passive method that utilizes fans to make air flow around the battery pack, promoting heat dissipation and maintaining a cooler operating temperature. The pros and cons of using air cooling of Lithium-ion batteries in EVs and also on hybrid vehicles are discussed in ref. [12]. While simple and cost-effective, air cooling has limitations that make it less suitable for high-power applications or extreme ambient temperatures. Liquid cooling is a viable alternative, an active method employing a liquid coolant, such as water or a glycol mixture, circulated through channels or tubes embedded within the battery pack. Liquid cooling offers superior heat transfer capabilities compared to air cooling and is increasingly considered also for residential battery storage systems due to its efficiency [13]. Liquid cooling systems are more complex than air cooling methods, requiring additional components like pumps, heat exchangers, and tubing. This complexity, however, contributes to increased costs and weight. Also, the presence of liquid introduces the potential for leaks, which can damage battery components and pose safety hazards. Careful design and material selection are therefore crucial to mitigate this risk. A further option for cooling lies in Phase Change Materials (PCMs) [14]. PCMs are substances that absorb and release heat during their phase change (solid to liquid or vice versa). They can be integrated into battery packs to passively absorb excess heat during operation and release it later to prevent overcooling. PCMs are often used in conjunction with other BTM methods for enhanced thermal regulation in residential systems due to their simplicity and low maintenance requirements.
Besides the cooling medium, BTM strategies play a decisive role. The traditional ones often rely on rule-based control of cooling/heating systems, which may not be adaptable to the complex and dynamic thermal behavior of batteries under varying operating conditions. Factors such as charge/discharge rate, ambient temperature, and state of health (SOH), in fact, significantly influence the battery thermal response [15]. The first requirement to make a reasoned choice for the most suitable BTM strategy is the knowledge or at least the estimation of the thermal field within a battery during its charge/discharge cycles. Numerical simulations may play a crucial role in this scope, allowing understanding and optimizing the battery behavior.
The first step in creating a thermal model of a battery, namely a virtual representation of how heat flows between battery cells, actually hinges on the knowledge of the battery structure [16]. Different materials and configurations affect heat transfer between cells and the external shield. Since various battery types exist, such as cylindrical, pouch, and prismatic Lithium-ion cells, the most suitable modeling approach to a certain battery pack is to be chosen carefully. It may differ based on several factors, such as the shape and size of the battery cell or pack, that significantly impact heat transfer patterns, and the different electrode materials and electrolytes with their respective thermal conductivities that affect the heat flow between cells. Furthermore, the arrangement of cells within a battery module influences the mathematical model to be used to represent its thermal behavior.
In recent years, on the other hand, the rapid advancement of numerical algorithms and data acquisition has empowered Machine Learning (ML) to become a versatile and efficient tool across diverse fields, including electronics, machinery, and advanced materials. The strength of ML lies in its ability to rapidly identify optimal solutions within complex systems with numerous variables, a task that proves to be challenging for traditional experimental and simulation methods. In particular, ML excels at predicting battery temperatures over time, enhancing BTM functionality, and enabling early warnings of potential thermal runaway events. This predictive capability stems from the ability of ML models to discern patterns in time-series data, distinguishing between reversible and irreversible heat generation, which is closely linked to charging/discharging currents. A variety of ML models, including Artificial Neural Networks (ANN), Convolutional Neural Networks (CNN), Long Short-Term Memory networks (LSTM), and Deep Reinforcement Learning (DRL), have been successfully applied to enhance battery thermal safety and resilience [17]. ML models, such as Recurrent Neural Networks (RNNs) and Long Short-Term Memory (LSTM) networks, are increasingly used to accurately estimate SOH and SOC, which are critical parameters for effective thermal management. These models can learn from historical data to predict battery degradation and adjust BTM control strategies accordingly [18,19]. ML techniques, including Artificial Neural Networks (ANNs) and Gaussian Process Regression (GPR), can be employed to develop accurate thermal models of LFP batteries. These models can predict temperature distributions within the battery pack under different operating conditions, enabling proactive thermal management control to prevent hotspots and ensure temperature uniformity [20]. Reinforcement learning (RL) algorithms are being explored for optimizing cooling control strategies in LFP battery packs. RL agents can learn from interactions with the environment to adaptively control cooling fans, pumps, or other actuators to minimize energy consumption while maintaining the battery within the desired temperature range [21].
ML models can be trained to detect and diagnose thermal faults in LFP batteries, such as cell overheating or cooling system malfunctions. By analyzing sensor data, these models can identify abnormal thermal behavior and trigger appropriate safety measures [22]. ML can also be used to optimize the design of BTM components, such as cooling channels and heat sinks. By analyzing simulation data, ML algorithms can identify optimal geometric parameters that maximize heat transfer efficiency and minimize pressure drop [23,24].
Within the present work, the behavior of a real battery under a charging/discharging daily cycle of a photovoltaic (PV) installation is considered in detail, so to verify the thermal performance and to also analyze possible conditions leading to runway. The battery is built in Southern Italy and is specifically conceived for residential use. The following approach within the paper consists of the development of a physics-based 0D/1D dynamic simulation model, built starting from a prototype cell and validated on experimental data, to then formulate a whole pack schematization enabling the simulation of different operating scenarios in a reasonable computational time. Two possible load conditions are considered and compared, and a further simulation is also presented as relevant to the risk of a thermal runaway occurrence initiating in one of the cells of the assembly.
2 Numerical Model of a LFP Battery
The here analyzed battery is assumed to be made starting from pouch cells in Lithium FerroPhosphate (LFP) technology with water-based solvents, for maximum efficiency and sustainability. The prototype cells, produced by the Company FIB S.p.A. (FAAM brand) belonging to Gruppo SERI (Carinaro, CE, Italy) [1], are designed to be assembled within a home storage system, typically associated with PV installations in residential settings, making electric energy available in intervals of time of high demand and/or of low solar generation. The battery can be installed both indoors and outdoors, under various configuration options depending on the needed storage capacity.
Within the present work, a base assembly is first considered of 4 kWh capacity in a “2p16s” configuration. The configuration “2p16s” refers to a specific arrangement of battery cells within a battery pack, commonly used in applications like large energy storage systems and EVs. “2p” indicates that the cells are arranged in 2 parallel groups, while “16s” indicates that within each parallel group, the cells are arranged in 16 series. In a series connection, the positive terminal of one cell is connected to the negative terminal of the next. This arrangement increases the voltage of the battery pack. In particular, 16 cells in series would result in a voltage 16 times that of a single cell. In a parallel connection, the positive terminals of the cells are connected together, and the negative terminals are connected together. This arrangement increases the capacity (amount of energy stored) of the battery pack. In this specific case, 2 parallel groups would double the capacity of a single series string. Therefore “2p16s” indicates two sets of 16 cells connected in series. These two sets are then connected in parallel. This configuration allows achieving: (1) higher voltage due to the series connection; (2) higher capacity for the parallel assembly; and (3) balancing, since parallel connections can also help with harmonizing the charge and discharge of cells, improving overall pack performance and lifespan.
2.1 Development and Validation of the Single-Cell Model
The simulation software used to predict the thermal behavior of the battery is the CRUISE™ M produced by the Austrian company AVL. The modeling primarily follows a dynamic 0D/1D approach, with thermal results also visualizable in 3D. The present work started by considering the single pouch cell, a prototype on which numerous tests were conducted experimentally by the Manufacturing Company.
One of the most useful measurements for a battery study is the open circuit voltage (OCV). The OCV of any device is the voltage when no load us connected to the rest of the circuit. The OCV reflects the potential difference between the two electrodes of a battery. This difference is a direct result of the internal chemistry and is an indicator of the state of charge (SoC), namely how much energy is stored in the battery at a given time. Therefore, this measure is generally used to characterize the relationship between SoC and OCV at the cell level. In the simplest configuration, a cell can be modeled as in the sketch of Fig. 2, as a simple resistance model (Rint model), where the main components are the OCV source and a single resistor [25]. The presented equivalent circuit model effectively captures the dominant resistive behavior of the battery under the considered operating conditions. More advanced schematizations become crucial at higher frequencies and during fast transient operations, as those proposed by Thevenin comprising an OCV source, ohmic resistance (R0), and one RC parallel network, or the dual polarization model, the PNGV model and the extended RC model [26]. Within the present study, to validate the numerical model of the single cell, the experimental tests of charge/discharge cycles were numerically reproduced.
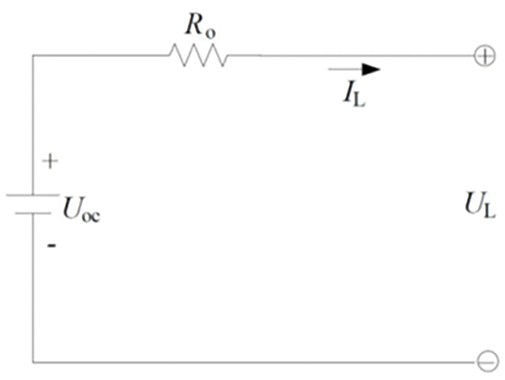
Figure 2: Open circuit cell model
Regarding the open OCV values, the two curves represented in Fig. 3 were assumed. The current intensity values were instead chosen according to the trend shown in Fig. 4.
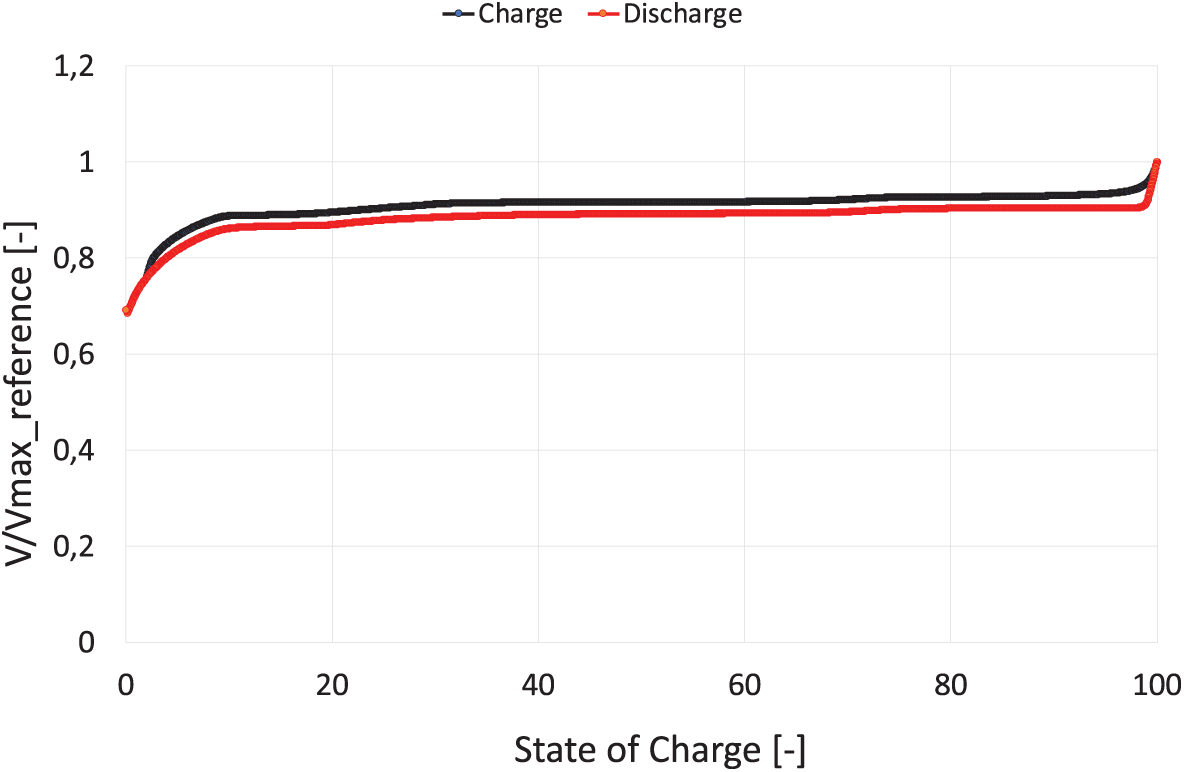
Figure 3: OCV in a charge/discharge cycle
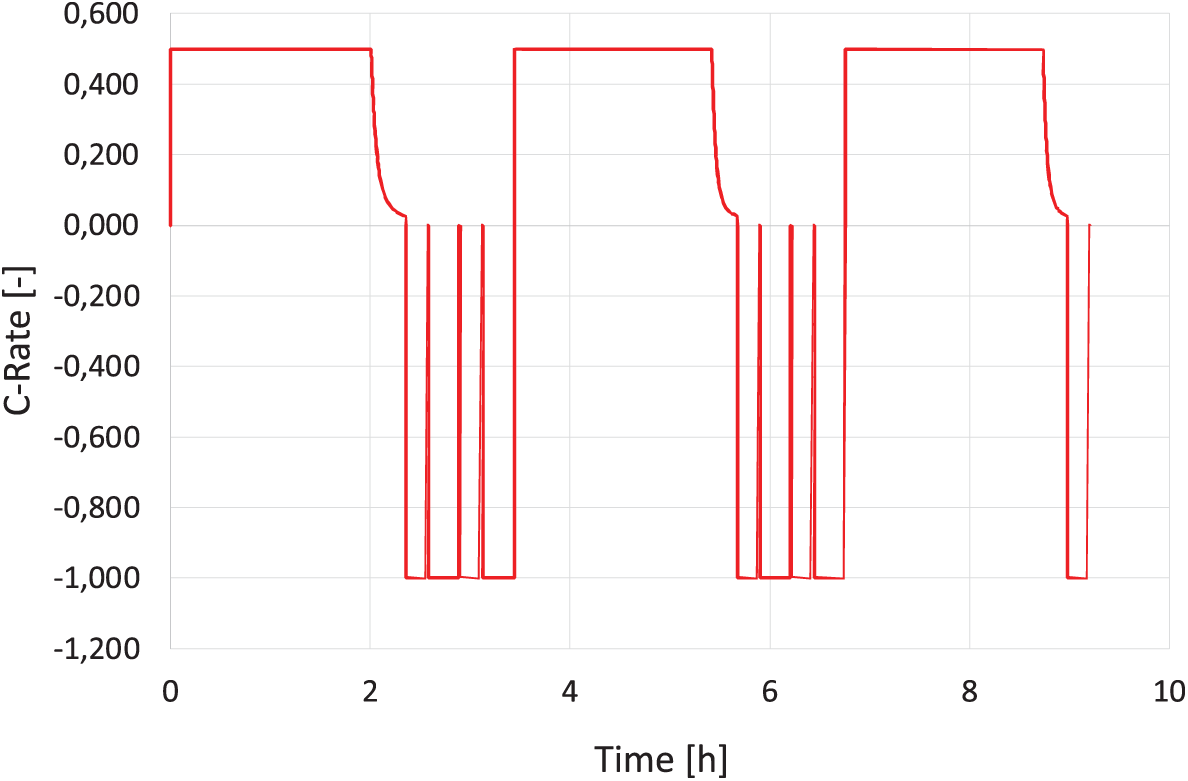
Figure 4: C-rate values in the charge/discharge experiments
The OCV curve was obtained as follows: during the charging phase, the single cell is powered with a constant current (CC) of 20 A, thus with a C-Rate equal to 0.5 (considering the nominal capacity of the cell as 40 Ah), and subsequently at CV (constant voltage) until the SoC of 100% is reached, which is achieved when the voltage gets its maximum value. A combination of CC and CV is used precisely to ensure that 100% SoC is certainly reached. It is noted that the current trend of Fig. 4 is parabolic at the point where operation is at constant voltage; and finally, at the point where the voltage reaches 100%, the current drops to zero. From here on, there is the so-called rest phase, which can vary from a few minutes to many hours (usually not exceeding 24 h). During this phase, there is a relaxation of the cell, and depending on the relaxation time, the voltage value may decrease; generally, it goes from 100% to about 90% of its maximum value, while still maintaining a SoC equal to 100%. After the rest phase, discharge begins, starting from a voltage that is usually lower than the 100% value for the reason described previously, and working exclusively with direct current with a C-Rate equal to 1C, until the cell voltage reaches its minimum value. Here too, before restarting the charge/discharge cycle, there is a relaxation phase in which the voltage level rises, settling at a value that is approximately 15% of its maximum value.
The voltage curves obtained from the simulations, compared with those provided by the laboratory tests, show an excellent correspondence with measurements, as evident in Fig. 5.
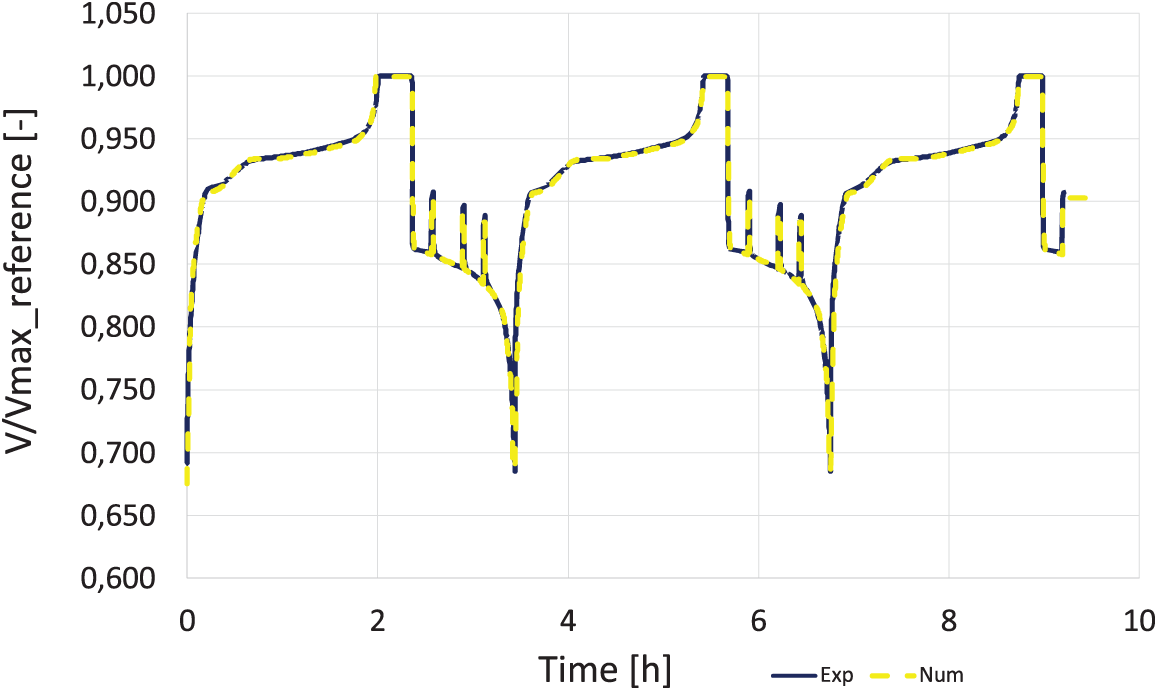
Figure 5: Comparison between experimental and numerical values
2.2 Development of the Module Model
At the battery level, the simulated system consists of two modules arranged in series, each containing 32 cells connected in parallel. The ambient temperature is set as the initial temperature, and the geometric conditions are fixed according to the actual design of the battery to be possibly built. Geometrical details are omitted for the sake of the intellectual property of the company.
To correctly perform the thermal analysis, all possible heat exchanges occurring within the system are simulated. Each cell is thermally connected. Each module is properly connected to adjacent surface elements or the other module to evaluate the temperature increase of cells when current passes through. The wall temperature is fixed at the ambient value. Furthermore, “plenums” elements are introduced to account for the air presence between the modules and the surface wall of the system.
Regarding the single-cell model, an OCV curve of the whole module is reconstructed, representing an average between the values of the charge curve and the discharge curves of Fig. 3.
To represent real-world energy demands, simulations were made to emulate typical household consumption patterns. The results of the realized simulations are hereafter discussed with specific reference to two real-world use cases of the battery, whose main details are summarized in Table 1. These differ for the discharge rate, namely for the actual load.
The two cases are indeed initially considered to evaluate the thermal behavior of the energy storage system under residential use where the same photovoltaic system is mounted on the roof and different house appliances utilize the renewable energy by withdrawing it from the battery. The doubling of energy demand corresponds to incorporating a diverse load profile that includes lighting, refrigeration, operation of household appliances (e.g., washing machine, dishwasher), and consumer electronics. The followed approach ensures that the simulated load profile reflects the intermittent and variable nature of residential energy uses. The resulting circuit configuration, while incorporating a load variable in time, maintains the fundamental characteristics of a power supply (the battery) and a dynamic load, thus allowing to appreciate the model’s applicability. Finally, Case 3 is also discussed as an accidental thermal runaway initiation simulated based on the initial assumptions of Case 1.
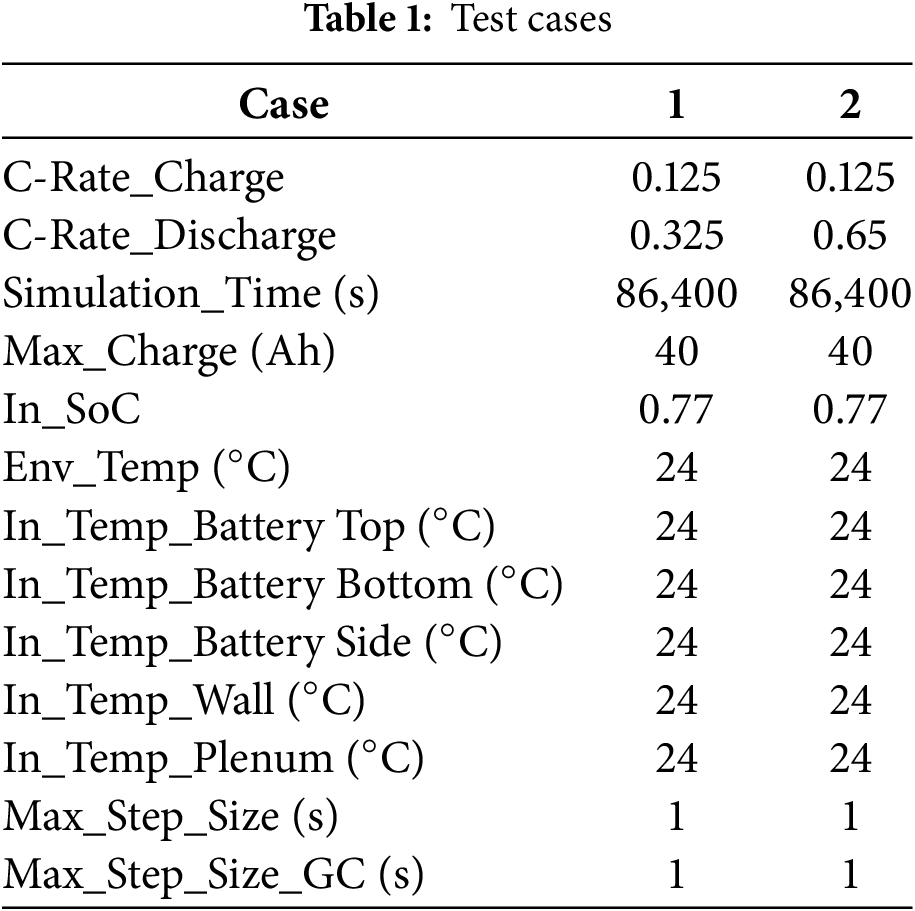
The C-rate relevant to the first analyzed case, Case 1, as defined by the battery management system (BMS) is represented in Fig. 6 on the left. For Case 2, instead, a C-rate as the one represented on the right of the same figure is supposed. Data refers to a residential daily use cycle. The C-rate is a measure of its discharge rate relative to its capacity. It is a unitless measure that represents the rate of charge or discharge of a battery relative to its nominal capacity. A positive C-rate signifies that the battery is being charged. As an example, a C-rate of +1.0 means the battery is being charged at a rate equal to its nominal capacity in one hour. A negative C-rate signifies that the battery is being discharged. As an example, a C-rate of −0.5 means the battery is being discharged at half its nominal capacity in one hour.
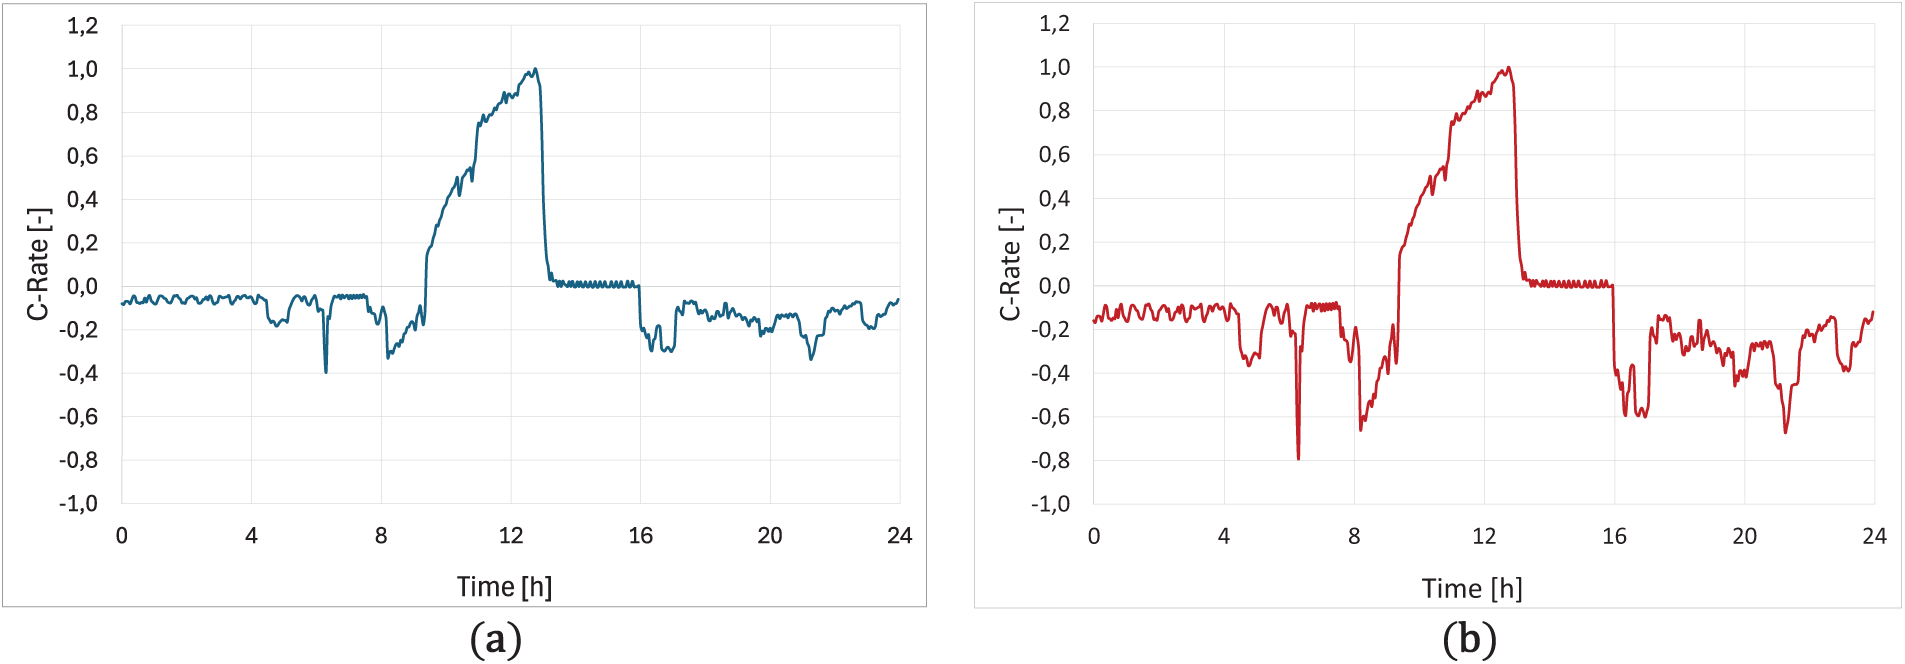
Figure 6: Experimental C-Rate: (a) Case 1; (b) Case 2
The graph of Fig. 6, therefore, represents the C-rate of two different energy loads over 24 h. Substantially, five intervals of time can be distinguished:
1. Initial Period (0–8 h): The C-rate starts at a low value, indicating a relatively low energy demand during this time. There are small fluctuations, suggesting some variability in the load due to the operation of electronic devices in standby mode.
2. Rapid Increase (8–12 h): A significant increase in the C-rate is observed, suggesting a rapid increase in solar energy generation and subsequent charging of the battery, coinciding with the rising sun.
3. Peak Charging (12–14 h): The C-rate reaches a peak around 12 h, indicating the highest charging rate, likely corresponding to peak solar irradiation.
4. Reduced Charging/Discharge (14–16 h): A sharp decline in the C-rate occurs between 14 and 16 h. This indicates a decrease in solar irradiation or a shift from charging to discharging as the energy demand from the load increases.
5. Fluctuating Discharge (16–24 h): The C-rate remains relatively low and fluctuates between 16 and 24 h. This suggests a period of low solar generation and potentially some discharge from the battery to meet the energy demand.
In the second examined case, Case 2, the photovoltaic system is the same as in Case 1 but the energy demand is doubled; therefore, the C-rate values are doubled only in the discharge phase, leaving the values unchanged in the charge phase, as shown in the right of Fig. 6b. It can be noted that the demand in the morning hours and the early evening is greater than in Case 1.
The scope of the hereafter discussed simulations is to verify the temperature of cells during the battery operating cycle. The simulated scenario mirrors the operational conditions of the residential storage for a PV system. The model provides valuable insights into the energy flows, predicting the battery response to the dynamic load profile and specifically, the simulation results, presented hereafter, offer a quantitative analysis of the voltage and current fluctuations under realistic operating conditions. In the context of a residential home with solar panels and battery storage, the interaction with the grid may be a critical aspect. The solar-battery system can operate in various modes: grid-tied, off-grid, or grid-interactive. In a grid-tied system, the solar panels and battery can supplement grid power, reduce energy consumption from the grid, and potentially feed excess energy back into the grid (net metering). The battery system acts as a buffer, storing energy when solar production exceeds demand and supplying energy when demand exceeds production or during periods of low solar generation. This interaction optimizes energy usage, enhances grid stability, and promotes the integration of renewable energy sources. Further analysis could explore the impact of different grid tariffs and incentives on the system’s economic viability and operational strategies. A thorough discussion on this aspect is however beyond the scope of this work but can be an important consideration for future research.
The simulations were indeed conceived to demonstrate the capability of the models to effectively manage energy storage and supply in a residential setting to verify the temperature increase in real-world scenarios. The results of the numerical simulation for Case 1 are summarized in Figs. 7 and 8. Analyzing the graph showing the voltage trend (Fig. 7a) and comparing it to that of the SoC (Fig. 7b), one may note how the charging phase is rapid and it is possible to reach 100% of SoC during the morning hours. Immediately afterward, there is a request from the user, and therefore a discharge phase occurs, but more slowly than the charging phase as it depends heavily on the energy demand. Furthermore, observing the voltage graph, it is evident that the maximum cell voltage is reached precisely in the hours in which the C-rate is maximum. Furthermore, the voltage value never reaches the minimum cell voltage precisely because the SoC value never goes below 60%.
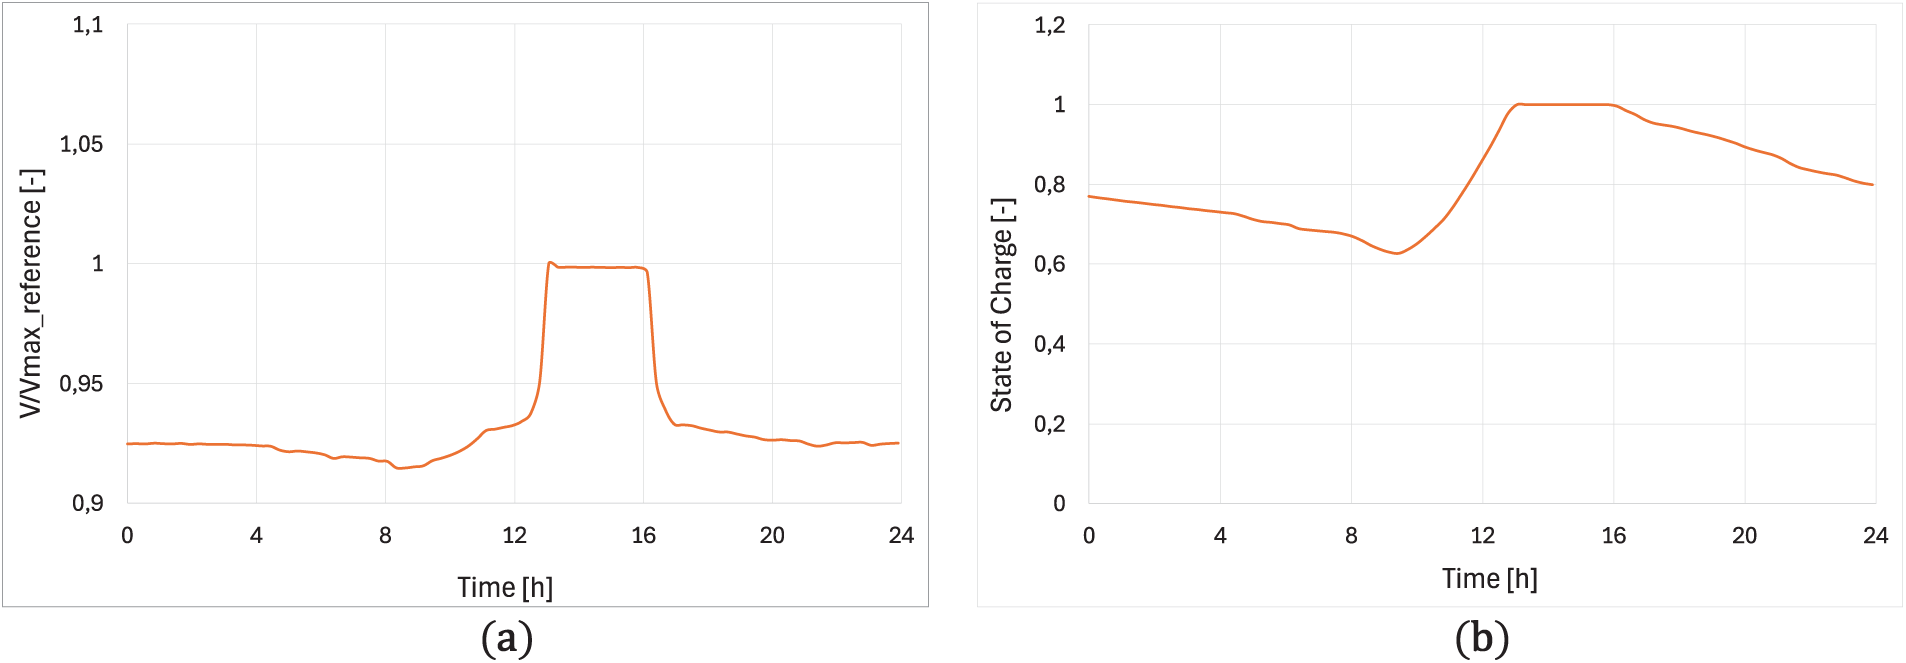
Figure 7: Case 1: Numerical results over 24 h use: (a) V trend; (b) State of Charge (SoC)
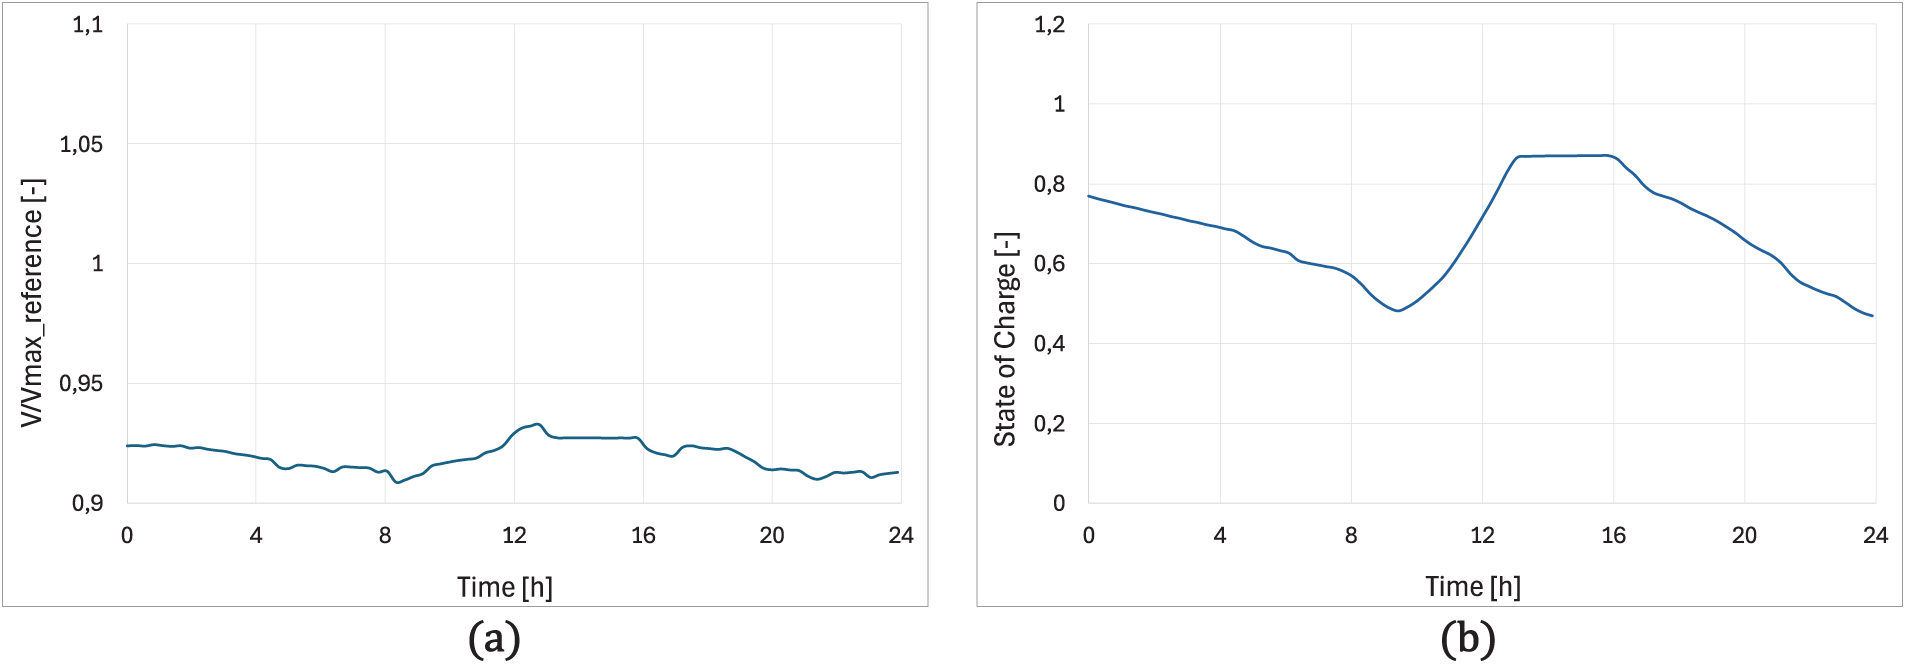
Figure 8: Case 2: Numerical results over 24 h use: (a) V trend; (b) State of Charge (SoC)
In Fig. 8, one may see results relevant to Case 2. The double demand for energy makes for the battery not to reach 100% of SoC (Fig. 8b) and discharges more rapidly with respect to what occurs under Case 1. From Figs. 9 and 10, on the other hand, one may note the cell temperature behavior during the day of operation of the battery in different cells of the module positioned on the top and under the two analyzed cases.
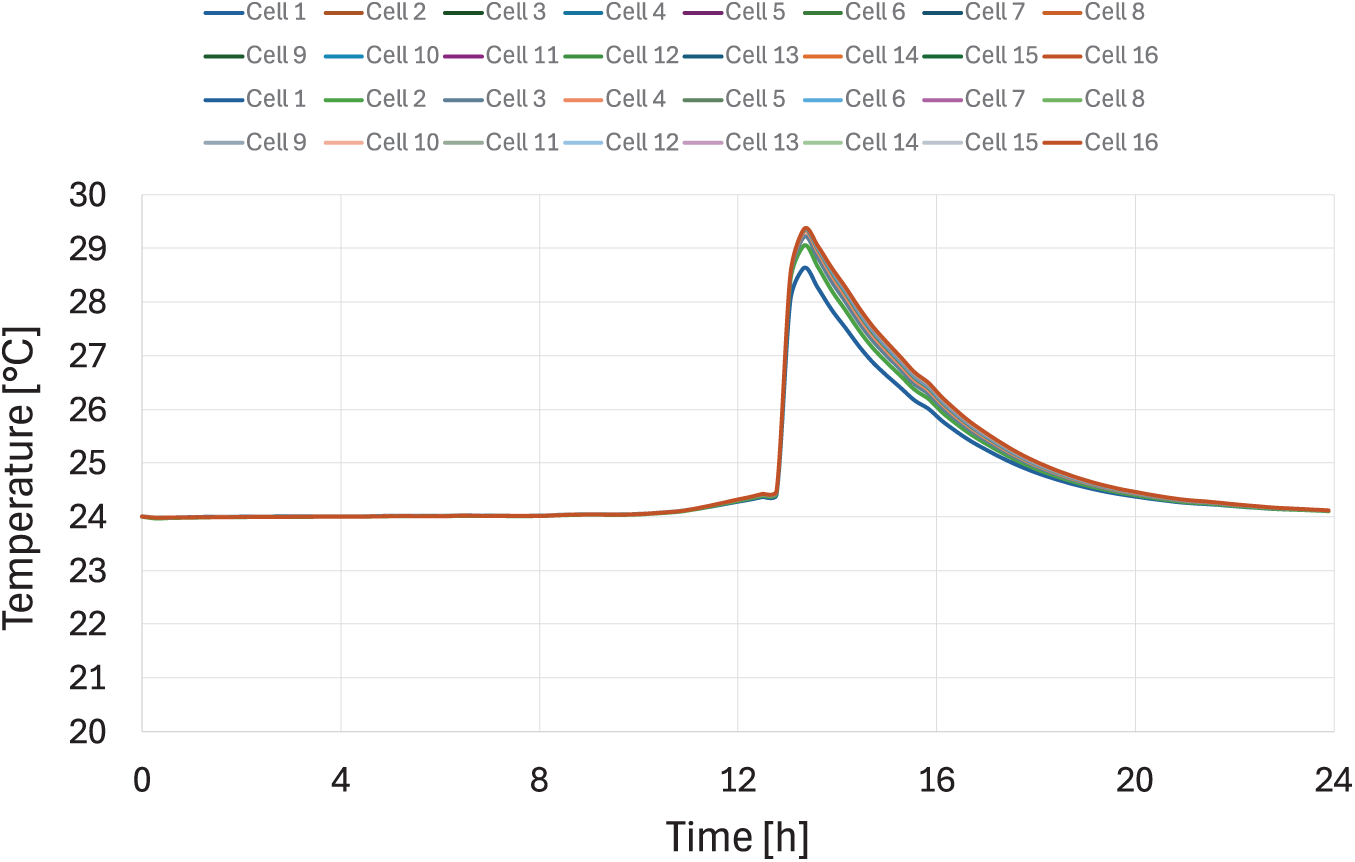
Figure 9: Case 1: Numerical results over 24 h of use: temperature of 16 cells of the top module
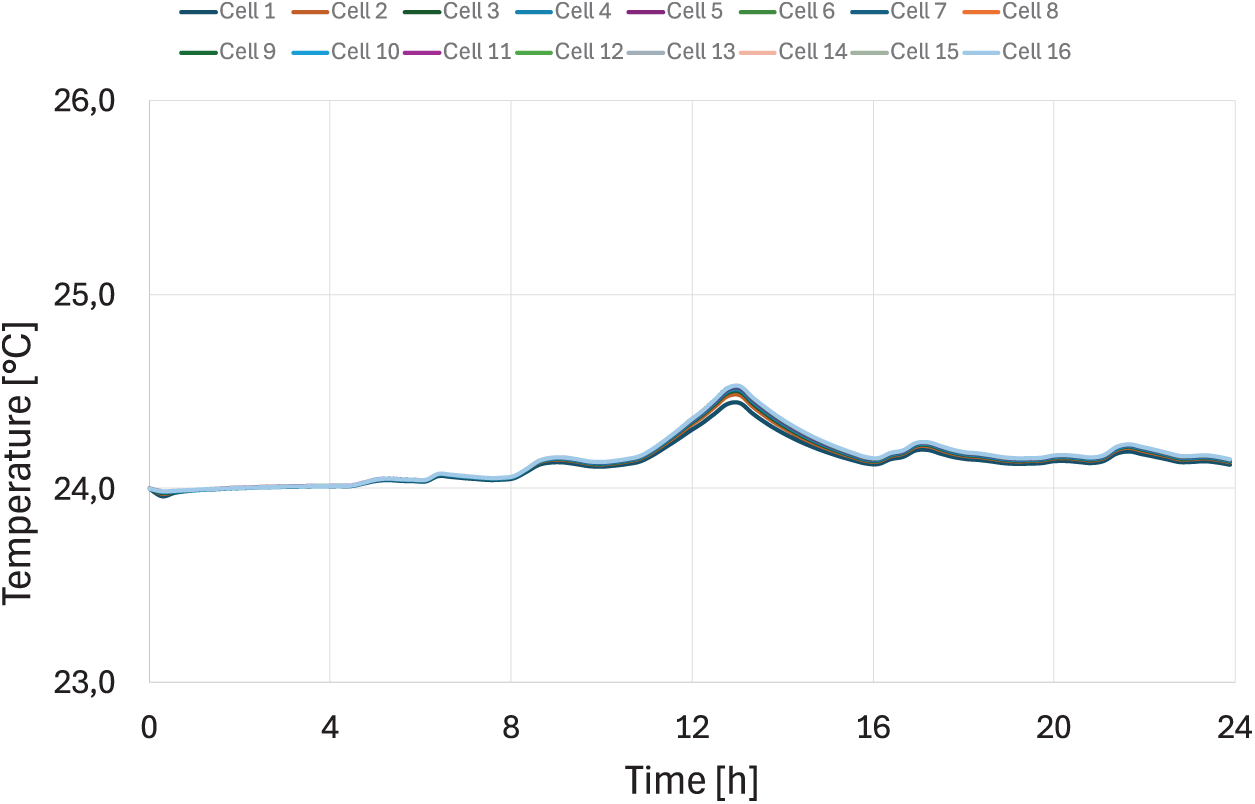
Figure 10: Case 2: Numerical results over 24 h of use: temperature of 16 cells of the top module
Moving from cell 1 to cell 16, which is positioned exactly in the center of the assembly, the temperature increases because the heat exchange is less effective. Comparing the temperature with the C-rate, one may note that the temperature peak, as one might expect, occurs in correspondence with the maximum C-rate value during the charging phase; subsequently, the current tends to a zero value (where cell balancing takes place) and consequently the temperature suddenly tends to reach the value of the environment.
Thermal Runaway
A thermal runaway initiation starting from assumptions of Case 1 is finally simulated and hereafter indicated as Case 3. The initiation of a thermal runaway in a cell of the “bottom module” was hypothesized. The calculation was considered by assuming a local heat source, based on some empirical information provided by the Company. The temperature in relevant positions, as calculated by the model, is represented in Fig. 11. In this case, time is expressed in seconds.
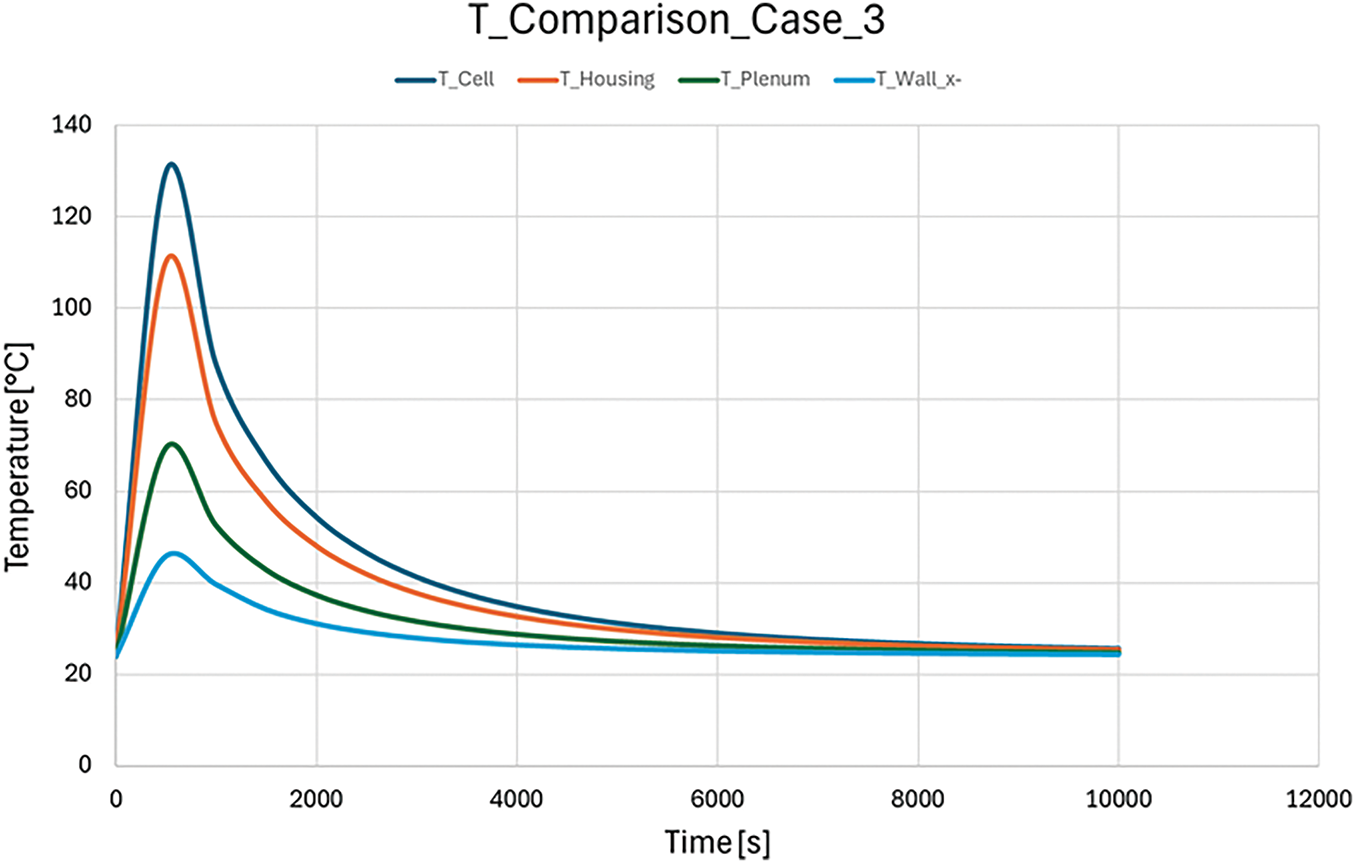
Figure 11: Comparison between significant temperatures
The thermal exchange between the cell in thermal runaway and the rest of the system remains within acceptable limits in this simulation; this occurs due to the short duration of the process and because the module casing is assumed as coated with an insulating material (polypropylene). Furthermore, the electrolyte, which acts as fuel because it is highly flammable, is consumed rapidly. This is certainly an advantage as it helps prevent any risk of fire or explosion. This result is quite significant because the battery is intended as a product for residential use, and it is therefore essential that it can operate under conditions of total safety, without necessarily needing to install a cooling system, to maintain relatively low costs.
As a final remark, it must be considered that the data presented in this study were collected during the summer operating conditions. This timeframe provided a representative dataset for evaluating the battery thermal performance under typical high-temperature conditions. However, it is recognized that battery performance can vary significantly across different seasons due to changes in ambient temperature and solar irradiance. Data collected over a longer time frame, encompassing seasonal variations from summer to winter, would provide a more comprehensive understanding of the system’s long-term performance and is recommended to enhance the generalizability of the findings.
This study investigates battery thermal behavior through a modeling approach, leveraging its inherent advantages over purely experimental methods. The future of this field undeniably resides at the confluence of materials science, computational modeling, and advanced engineering. As technological demands escalate, the precise control and optimization of thermal dynamics will assume utmost importance. Ongoing research endeavors promise to elucidate and manage the intricate thermal behaviors of battery systems through sophisticated computational approaches.
The battery model here presented was developed within the CRUISE M™ environment and rigorously validated against experimental data provided by the manufacturing company’s technical offices as relevant to an LFP prototype cell. Utilizing the validated model, the thermal behavior of the battery designed for residential energy storage in conjunction with domestic photovoltaic systems, was analyzed and simulated.
Two distinct scenarios are assumed, representing a typical summer daily cycle with varying current values during both the charging and discharging phases. A comparative analysis of these scenarios unequivocally demonstrates the significant impact of current fluctuations on system temperature. Furthermore, simulations are conducted to investigate an extreme scenario, namely a thermal runaway, that is a critical consideration for ensuring the market release of a reliable and safe product.
The thermal analysis conducted in this study indicates that, under the specified operating conditions and load profile, the LFP battery pack does not necessitate the installation of an active cooling system. The temperature rise observed during dynamic charge and discharge cycles remains within acceptable limits for safe and efficient operation. Therefore, the energy requirements of the solar panels are not impacted by the need to power a cooling system. However, it is important to note that this conclusion is specific to the analyzed scenario. Different operating conditions, higher ambient temperatures, or more demanding load profiles could potentially require the implementation of a cooling system. Future work could deeply explore the design and integration of such systems and their impact on overall energy consumption.
Acknowledgement: The authors are grateful to the FIB S.p.A. Company for the consensus to publish the present paper and for the availability of confidential data relevant to cells and battery products.
Funding Statement: The authors did not receive any funding for the present study.
Author Contributions: The authors confirm their contribution to the paper as follows: Conceptualization, Michela Costa and Adolfo Palombo; methodology, Ugo Sorge; software development and validation, Andrea Ricci; writing—original draft preparation, Michela Costa; writing—review and editing, Michela Costa; visualization, Andrea Ricci; supervision, Ugo Sorge. All authors reviewed the results and approved the final version of the manuscript.
Availability of Data and Materials: Data is not available due to commercial restrictions. Due to the nature of this research, participants of this study did not agree for their data to be shared publicly, so supporting data is not available.
Ethics Approval: Not applicable.
Conflicts of Interest: The authors declare no conflicts of interest to report regarding the present study.
Abbreviations
| ANN | Artificial Neural Networks |
| BMS | Battery Management System |
| BTM | Battery Thermal Management |
| CNN | Convolutional Neural Networks |
| DRL | Deep Reinforcement Learning |
| EV | Electric Vehicle |
| GPR | Gaussian Process Regression |
| LFP | Lithium FerroPhosphate |
| LSTM | Long Short-Term Memory |
| ML | Machine Learning |
| OCV | Open Circuit Voltage |
| PCM | Phase Change Material |
| PV | Photovoltaic |
| RL | Reinforced Learning |
| RNN | Recurrent Neural Network |
| SoC | State of Charge |
| SoH | State of Health |
References
1. FIB S.p.A.—FAAM. [cited 2025 Jan 1]. Available from: https://faam.com/en/lihome/. [Google Scholar]
2. Wang Y, Zhang X, Li K, Zhao G, Chen Z. Perspectives and challenges for future lithium-ion battery control and management. eTransportation. 2023;18(6):100260. doi:10.1016/j.etran.2023.100260. [Google Scholar] [CrossRef]
3. van Eck NJ, Waltman L. Software survey: VOSviewer, a computer program for bibliometric mapping. Scientometrics. 2010;84(2):523–38. doi:10.1007/s11192-009-0146-3. [Google Scholar] [PubMed] [CrossRef]
4. Xu B, Lee J, Kwon D, Kong L, Pecht M. Mitigation strategies for Li-ion battery thermal runaway: a review. Renew Sustain Energy Rev. 2021;150:111437. doi:10.1016/j.rser.2021.111437. [Google Scholar] [CrossRef]
5. Hendricks C, Williard N, Mathew S, Pecht M. A failure modes, mechanisms, and effects analysis (FMMEA) of lithium-ion batteries. J Power Sources. 2015;297(1):113–20. doi:10.1016/j.jpowsour.2015.07.100. [Google Scholar] [CrossRef]
6. Sun P, Bisschop R, Niu H, Huang X. A review of battery fires in electric vehicles. Fire Technol. 2020;56(4):1361–410. doi:10.1007/s10694-019-00944-3. [Google Scholar] [CrossRef]
7. Ghaeminezhad N, Wang Z, Ouyang Q. A Review on lithium-ion battery thermal management system techniques: a control-oriented analysis. Appl Therm Eng. 2023;219(3):119497. doi:10.1016/j.applthermaleng.2022.119497. [Google Scholar] [CrossRef]
8. Liu H, Wei Z, He W, Zhao J. Thermal issues about Li-ion batteries and recent progress in battery thermal management systems: a review. Energy Convers Manag. 2017;150:304–30. doi:10.1016/j.enconman.2017.08.016. [Google Scholar] [CrossRef]
9. Wang Y, Gao Q, Wang G, Lu P, Bao W. A review on research status and key technologies of battery thermal management and its enhanced safety. Int J Energy Res. 2018;42(13):4008–33. doi:10.1002/er.4158. [Google Scholar] [CrossRef]
10. Li W, Zhou Y, Zhang H, Tang X. A review on battery thermal management for new energy vehicles. Energies. 2023;16(13):4845. doi:10.3390/en16134845. [Google Scholar] [CrossRef]
11. Lin J, Liu X, Li S, Zhang C, Yang S. A review on recent progress, challenges and perspective of battery thermal management system. Int J Heat Mass Transf. 2021;167:120834. doi:10.1016/j.ijheatmasstransfer.2020.120834. [Google Scholar] [CrossRef]
12. Zhao G, Wang X, Negnevitsky M, Zhang H. A review of air-cooling battery thermal management systems for electric and hybrid electric vehicles. J Power Sources. 2021;501(1):230001. doi:10.1016/j.jpowsour.2021.230001. [Google Scholar] [CrossRef]
13. Xu J, Guo Z, Xu Z, Zhou X, Mei X. A systematic review and comparison of liquid-based cooling system for lithium-ion batteries. eTransportation. 2023;17:100242. doi:10.1016/j.etran.2023.100242. [Google Scholar] [CrossRef]
14. Mahmud M, Rahman KS, Rokonuzzaman M, Habib AA, Islam MR, Motakabber SM, et al. Lithium-ion battery thermal management for electric vehicles using phase change material: a review. Results Eng. 2023;20(11):101424. doi:10.1016/j.rineng.2023.101424. [Google Scholar] [CrossRef]
15. Yang S, Ling C, Fan Y, Yang Y, Tan X, Dong H. A review of lithium-ion battery thermal management system strategies and the evaluate criteria. Int J Electrochem Sci. 2020;14(7):6077–107. doi:10.20964/2019.07.06. [Google Scholar] [CrossRef]
16. Barcellona S, Piegari L. Lithium ion battery models and parameter identification techniques. Energies. 2017;10(12):2007. doi:10.3390/en10122007. [Google Scholar] [CrossRef]
17. Li A, Weng J, Yuen ACY, Wang W, Liu H, Lee EWM, et al. Machine learning assisted advanced battery thermal management system: a state-of-the-art review. J Energy Storage. 2023;60(16):106688. doi:10.1016/j.est.2023.106688. [Google Scholar] [CrossRef]
18. Teixeira RS, Calili RF, Almeida MF, Louzada DR. Recurrent neural networks for estimating the state of health of lithium-ion batteries. Batteries. 2024;10(3):111. doi:10.3390/batteries10030111. [Google Scholar] [CrossRef]
19. Dini P, Colicelli A, Saponara S. Review on modeling and SOC/SOH estimation of batteries for automotive applications. Batteries. 2024;10(1):34. doi:10.3390/batteries10010034. [Google Scholar] [CrossRef]
20. Olabi AG, Abdelghafar AA, Soudan B, Alami AH, Semeraro C, Al Radi M, et al. Artificial neural network driven prognosis and estimation of Lithium-Ion battery states: current insights and future perspectives. Ain Shams Eng J. 2024;15(2):102429. doi:10.1016/j.asej.2023.102429. [Google Scholar] [CrossRef]
21. Tavakol-Moghaddam Y, Boroushaki M, Astaneh M. Reinforcement learning for battery energy management: a new balancing approach for Li-ion battery packs. Results Eng. 2024;23(33):102532. doi:10.1016/j.rineng.2024.102532. [Google Scholar] [CrossRef]
22. Zhao J, Feng X, Tran MK, Fowler M, Ouyang M, Burke AF. Battery safety: fault diagnosis from laboratory to real world. J Power Sources. 2024;598(1):234111. doi:10.1016/j.jpowsour.2024.234111. [Google Scholar] [CrossRef]
23. Zhou X, Guo W, Shi X, She C, Zheng Z, Zhou J, et al. Machine learning assisted multi-objective design optimization for battery thermal management system. Appl Therm Eng. 2024;253(1):123826. doi:10.1016/j.applthermaleng.2024.123826. [Google Scholar] [CrossRef]
24. Al Miaari A, Ali HM. Batteries temperature prediction and thermal management using machine learning: an overview. Energy Rep. 2023;10(11):2277–305. doi:10.1016/j.egyr.2023.08.043. [Google Scholar] [CrossRef]
25. He H, Xiong R, Fan J. Evaluation of lithium-ion battery equivalent circuit models for state of charge estimation by an experimental approach. Energies. 2011;4(4):582–98. doi:10.3390/en4040582. [Google Scholar] [CrossRef]
26. Hu X, Li S, Peng H. A comparative study of equivalent circuit models for Li-ion batteries. J Power Sources. 2012;198:359–67. doi:10.1016/j.jpowsour.2011.10.013. [Google Scholar] [CrossRef]
Cite This Article
 Copyright © 2025 The Author(s). Published by Tech Science Press.
This work is licensed under a Creative Commons Attribution 4.0 International License , which permits unrestricted use, distribution, and reproduction in any medium, provided the original work is properly cited.
 Downloads
 Citation Tools